4.3. Dashboard
4.3.1. Introduction
After a tap on the Dashboard button in the main menu this panel is shown. See Menu.
Note
The Dashboard section is automatically refreshed every 60 seconds.
4.3.2. Status
The head section of the Dashboard displays indicators about Community Membership status and application runtime:
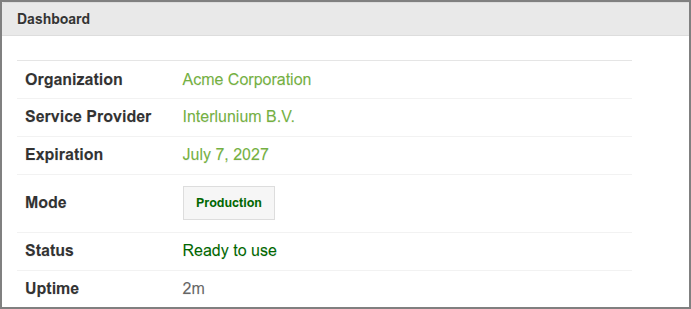
Admin Web App: Dashboard - Membership
Organization : The name of your organization. It must be entered in the Organization section of the About page.
Service Provider : The name of the support organization in the uploaded Service Card, or none if no Service Card is uploaded. See Support.
Expiration : expiration date of Service Card.
Mode : the system mode. Press the button to change the mode to Maintenance or Production.
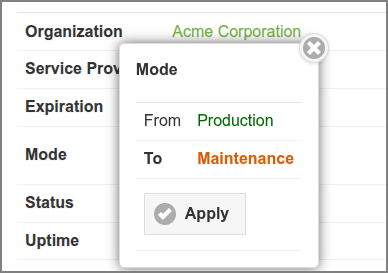
Admin Web App: Dashboard - System Mode
When system is in Maintenance Mode:
Access to all Web Apps is restricted to users with Administrator role.
Regular users are shown a message explaining the situation, at the Login dialog or in the authorized session.
Status
Ready to use : SavaPage can be used without impediments.
Setup is needed : There are one or more options that need to be set up. Press the Currency, Mail and Organization button to do so. See Currency Code, Mail and Organization.
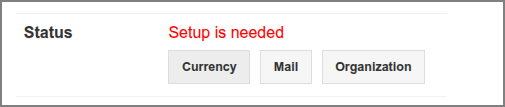
Admin Web App: Dashboard - Setup is needed
Access to the User Web App is denied till setup is finished. In the Admin Web App, editing of user details and adding internal users, user groups and shared accounts will not be available.
Not available : Database access is blocked because a batch job is in progress (database backup, user synchronization, database cleanup). To prevent that user actions requiring database access will block, resulting in long waits, access to the User Web App is temporarily denied. Users are informed after a login attempt or, when already logged in, are warned when actions requiring database access are not permitted.
Environment : shown if SavaPage runs in Docker. See Environment.

Admin Web App: Dashboard - Environment
Uptime : the time the application has been working and available.

Admin Web App: Dashboard - Users
Users : the number of users in the database (excluding Deleted Users) appended with the result of the latest User Home Clean.
Cleanup is done nightly, but can be ad-hoc started by pressing the refresh button at the right of the cleanup timestamp.
In this example there are
42users in the database. At the time of the cleanup32users have used the User Web App and thereby have a User Home safepages location on disk, and in all User Homes,1file is unidentified,16documents are stored because of using SavaPage as Printer, and3Hold Print jobs are pending. The number of bytes of each total is displayed when moving the cursor over it, or by pressing the information button at the right.The number of cleaned files is communicated with a separate icon as shown below:

Admin Web App: Dashboard - User Home Clean
In this example a total of
4documents and/or jobs are cleaned. Press the information button at the right to see details like “Cleaned: 2 Users. 1 Document: 36 KB. 3 Jobs: 121 KB”.When Cleanup Test Mode is set, cleanable files are signaled without actually being deleted. In that case the clean icon will show a red colored marker.
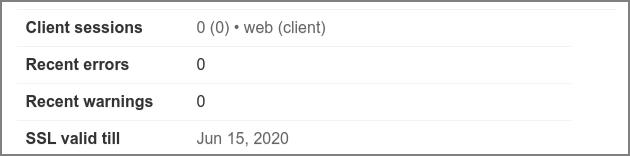
Admin Web App: Dashboard - Sessions and Messages
Client sessions : the number of active User Web App and User Client sessions.
Recent errors : the number of errors that occurred in the Application Log during the last hour.
Recent warnings : the number of warnings that occurred in the Application Log during the last hour.
SSL valid till : when the SSL Certificate of SavaPage expires within a year, its expiration date is shown . When expiration is due within 30 days it is shown in orange. Note: SSL expiration of any reverse proxy server used by SavaPage clients is not signaled.

Admin Web App: Dashboard - OpenPGP
OpenPGP information is shown when server keys are configured: see OpenPGP Settings. Press the information button at the right to see the KeyID and Fingerprint.

Admin Web App: Dashboard - Tickets
Tickets : Print and Copy Job totals just as in Job Tickets Web App, or zero (“0”) if ticket queue is empty.
4.3.2.1. Technical Info
Technical information about the server process can be added to, or
removed from, the Dashboard by setting the value of configuration key
webapp.admin.dashboard.show-tech-info to Y or N. See
Config Editor on how to
change this value. When added, the following extra information appears:
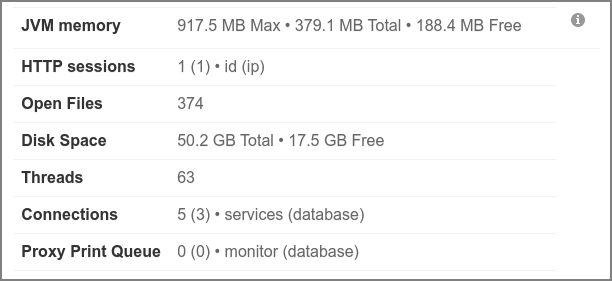
Admin Web App: Dashboard - Technical Information
JVM memory : “Max” is the maximum memory the JVM will attempt to use. “Total” is the total memory in the JVM (varies over time). “Free” is the free memory in the JVM (increases after a garbage collect).
HTTP sessions : the number of non-expired Web App Session id’s and their client ip addresses. Due to DHCP, the number of ip’s may be greater than the number of id’s.
Open Files : The number of open file descriptors.
Disk Space : Disk capacity and free space.
Threads : An estimate of the number of active process threads.
The number of “active (deadlocked)” threads (if any) are shown in red color. See System Monitor.

Admin Web App: Dashboard - Deadlocked Threads (intentionally caused as example)
Connections : The number of active connections to internal services and the database.
Proxy Print Queue : The number of pending Proxy Print jobs in memory cache and the database.
4.3.2.2. System Monitor
A System Monitor process checks SavaPage server health status every
120 seconds. This frequency is set in
configuration property
system.monitor.heartbeat-sec. The following situation is checked:
Deadlocked threads : JVM threads that are deadlocked waiting for “object monitors” [1] or “ownable synchronizers” [2] . The number of deadlocked threads is shown as Technical Info on the Dashboard. Detailed information can be found in the
server.log: see Logs.Important
Deadlocked threads should not happen. When they occur, contact your SavaPage Service Provider.
4.3.3. Services
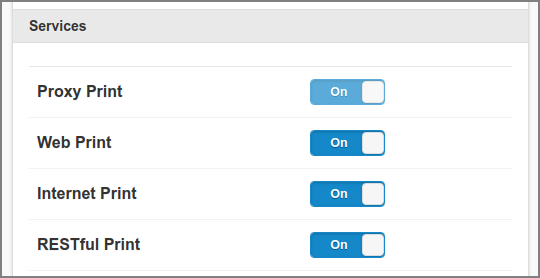
Admin Web App: Dashboard - Services
This section lists the status of services.
The Proxy Print indicator is read-only, and shows the CUPS connection status. When connectivity is broken, the switch shows “Off”, with the reason displayed at the right.
Core services like Mail Print must be enabled to be on the list.
Web Print, Internet Print and RESTful Print services are a fixed part of the list.
Plug-in services like Mollie Payment Gateways are part of the list if they are enabled in their property file.
Administrators with Dashboard Editor Privileges can turn a service On or Off by flipping the status switch. For administrators with Reader Privileges service switching is disabled.
When the SavaPage server restarts enabled core services are turned
On by default. The initial state of enabled plug-in services is
governed by the online setting in their property file. The on/off
state of Internet Print
translates to the enabled/disabled state of the reserved /internet
Queue.
4.3.4. News
The News section shows the currently installed versus the latest published SavaPage version. A push on the button at the bottom of the section brings you to the “Downloads and Release Notes” Internet page.
Note
The latest published SavaPage version number is cached on the server and retrieved from the Internet every 12 hours.
4.3.5. Pagometers
The Pagometers [3] counting the pages printed-out with Proxy Printers, printed-in from SavaPage Queues, and exported as PDF are displayed in a Pie-Chart. Pagometers are explained at Pagometers.
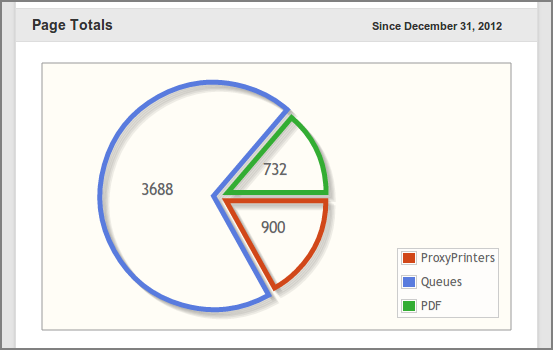
Admin Web App: Dashboard - Pagometer
A Line-Graph shows the day pagometers for the three sources over the last 30 days.
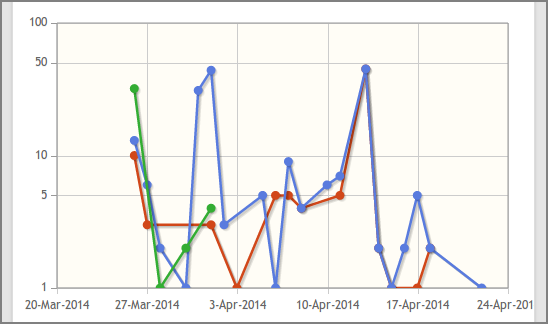
Admin Web App: Dashboard - Pagometer Trend
A table shows the running Total of Received PDF documents by Driverless File Transfer Print that are Valid, Repaired or Rejected, including totals for last Week and Month. See Processing Driverless PDF Transfer.
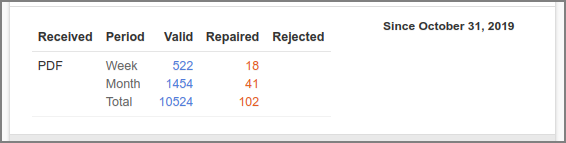
Admin Web App: Dashboard - Pagometer Print-in PDF
4.3.6. Environmental Impact
The Environmental Impact for the Proxy Printer pagometer are displayed in a separate section. The metrics and units used are discussed at Environmental Impact.
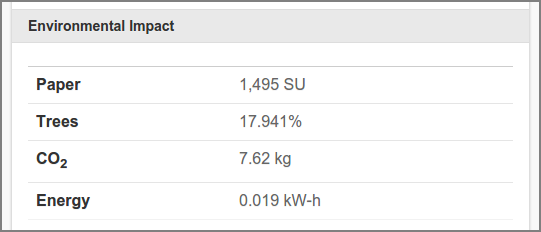
Admin Web App: Dashboard - Environmental Impact
The Environmental Impact section can be hidden with configuration property in table below.
Configuration property |
Description |
|---|---|
webapp.admin.dashboard.show-env-info |
Set to |
See Config Editor on how to set these items.
4.3.7. Financial Summary
A Financial Summary of User Accounts, Point-of-Sale and Payment Gateway amounts are displayed in a separate section.
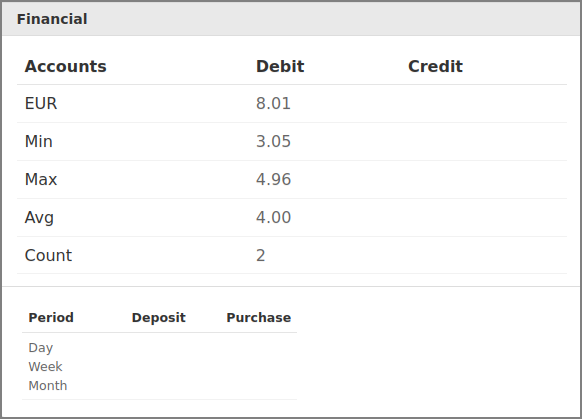
Admin Web App: Dashboard - Financial Summary
The User Accounts total and statistics like Min, Max and Avg are shown as Debit or Credit amount over Count number of accounts. Also, Deposit and Purchase amounts are shown from the Point-of-Sale Web App. The summary is updated as the dashboard is (auto) refreshed.
Note
Payments via a Payment Gateway Plug-in are shown as External besides Deposit and Purchase amounts.
4.3.8. Filtered Requests
This section shows the operation of all possible HTTP Service Filters when at least one of them is enabled.
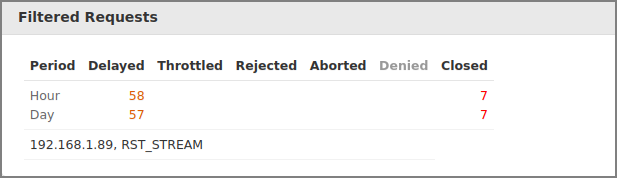
Admin Web App: Dashboard - Filtered Requests
Request that exceed Denial of Service Filter limits, are Denied by the Inet Access Filter or are Closed due to HTTP/2 Rate Control are totaled over the last Hour and current Day. The filtering subjects (remote IP addresses, or other descriptors) acquired during the day are shown at the bottom of the table. Data is updated as the dashboard is (auto) refreshed. The column headers of inactive filter actions are grayed out.
See Denial of Service Filter, Inet Access Filter and HTTP/2 Rate Control for configuration options.
Note
Statistics are collected during the server process. After a server restart, collection starts again from scratch.
4.3.9. Real-time Activity
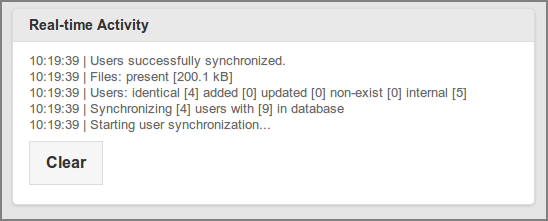
Admin Web App: Dashboard - Real-time Activity
Relevant system events are real-time displayed in this section. A maximum of 20 event messages remain in view, with the most recent one at the top.
System events are persisted in the rotating log file:
/opt/savapage/server/logs/adminpublisher.log
This file has a tab separated value (TSV) format for easy import and manipulation into spreadsheet programs. See log4j.properties for more information.